Pages

Open Cadastral Data: a Github Test Case

Wednesday, July 24, 2013

A bolt of GIS-Manna from Heaven

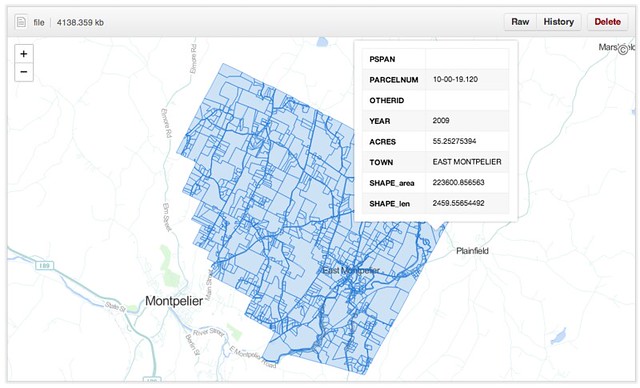
A dedicated and talented GIS developer at the VT Agency of Natural Resources just finished compiling the most-comprehensive cadastral dataset to which our small state has ever had access. Coincidentally he sent out the announcement while I was annoying a few githubbers about their new geodata capabilities. What luck: a test case.

The dataset - as a shapefile - clocks in at 250MB, representing 289,000 parcel polygons in 191 towns. [The 46 VT towns not included tend to have populations under 200 and a blithe commitment to dusty paper records.] It turns out that this is over the 100MB limit imposed on individual files, so I pulled the dataset, split it by town and converted the outputs to geojson, then pushed them to a repository I just set up. The largest of these is juuuuust over the maximum file size to be renderable in Github's snazzy new Mapbox-based interactive maps, but most of the town parcel maps pop up just fine.

The Implications

Okay, great - another slippy map somewhere on the web. Who cares? These folks, actually:
  • A landowner who wants to look up the parcel numbers of her abutting properties without visiting the steam pipe distribution venue in the basement of her local town hall.
  • A town GIS manager who has a hard drive overflowing with parcel shapefiles, converted CAD drawings and map requests from lawyers.
  • Probably a lot of lawyers. Don't get me started.    
  • The overworked data gurus at the Vermont Center for Geographic Information (VCGI), who - while they're probably the only agency that can handle it - are really reluctant to take on management of a statewide, rolling, versioned database.

What Github provides in this test case, for free:
  • Fast hosting of modestly-large geospatial data
  • Relatively-simple version control of said data
  • Edit access to anyone with a github account and a GIS platform (FOSS or Arc'ed)
  • An embeddable client view for the public for files up to 10MB
  • A robust API for client views bigger than that (for example)
  • A muthaflippin' download button (well, "save page as")
For those of us who have been ranting about geoportals in recent months, this pretty much covers the bases. For free. Github is walking the #opendata walk.


What's Next . . .

There are a whole bunch of caveats here. Biggest is the file size issue (though I've seen Bill Dollins and Sophia Parafina starting to work around that in the past few days), since 10MB is a fine limit for municipalities in the second-smallest state, but Manhattan is a teensy bit bigger. Another hitch is data quality; this dataset is top-of-the-line, but like any other it's missing SPAN numbers, dates and acreages here and there. The vendors will tell you that quality can't be beefed up in a free collaborative environment, without data value-add. I don't know if they're right or wrong.

But I'd love to see a town GIS manager throw a pull request and get this ball rolling. Who's up for it?

The data hub is waiting right here


Update: 7/25/13
I've heard a bunch of awesome questions about the practicalities of using Github this way, so while I am by no means a power user I recorded a quick demo video.
Read more ...

Maps in a Responsive Page

Sunday, July 21, 2013


Heaven help me - I've been building a responsive infographic.

Specifically, I used Bootstrap to flesh out a not-really-infinite-scroll site that summarizes the findings of a survey - done by some #opengov types on social media use in the Vermont legislature. Getting the infographic confession aside, my point in mentioning it is that I wanted to include a map of responses by county, and that posed a dilemma.

I went with a responsive layout for the page because I know that 50% or more of the traffic will be from mobile clicks - the kind of viewing experience that makes a tricked-out slippy map either frustrating or useless. So I'd need something more flexible than my usual portfolio. Fortunately, a few months ago responsive-design-zealot Brad Frost had talked about using a combination of static and dynamic maps for the same purpose depending on available screen real estate. I thought it was cool but at the time had no use for it. Enter this recipe:

Ingredients:
1.) An API that provides both static and dynamic endpoints: Check. Mapbox FTW.
2.) A Responsive layout: Check. Bootstrap is out-of-the-box.
3.) A snippet of javascript to load the map according to screen size: Check. Repurposed here.

I knocked together a dynamic map using Tilemill and mapbox.js - this let me do some cool linking of SVG hover states and popup information windows. As a bonus I could disable pan and zoom to make it more like an interactive image and fit better into the overall page context. [Yes, haters, you're right - I should have done this with D3. Gimme a break; I'll get to it.] I then grabbed the map's PNG equivalent from the Mapbox Static API and plugged it into the code as the "static" option.

In Mr. Frost's original his "embed" option for larger screens is the standard google maps embed string. I wanted more features than were available with a standard mapbox embed, so I built the site separately with mapbox.js and "iframed" it in. This is just as much of an ugly hack as it seems, but it works.

The result is a map that renders big and fully-interactive on tablets and larger:


But shows a teaser image and a link to see more on a small screen:


This is obviously not a perfect solution, but it fits the purpose here. And it's also extendable - consider if you had to generate dozens of pages like this - you could do it just by programmatically changing the lat/lon or index value of both the static and the embed maps. Also worth noting is that this strategy works with both Mapbox and Google APIs.

As we move into a web that's even more solidly mobile-centric, we'll need to keep adapting maps with the resources we have available. It's actually a lot of fun trying to keep up.

Click here to see it in action

Read more ...

Tiled Basemaps: the Survey

Monday, July 8, 2013


The time has come once again for a taking of the geopulse! In years past I've asked broad questions about platform-level technology use, but this year I'm getting more specific:


Yes, I realize that the very concept of tiles is about to go the way of the Avenue script, but the present moment is still flush with amazing cartography served up in square chunks. For this survey I've chosen a selection of "Streetmap" styles from the major players, since imagery is another can of worms entirely.

I've built a comparison app here (with thanks to Dair Grant for the idea). Check it out and vote for your favorite.

Note: It's not possible to get a perfect comparison, since some maps tiles are locked to a particular API (what up, Apple), and others were too hard to parse into a single web map (Was a quadkey scheme really necessary, Bing?). Feel free to add these in if they serve as your go-to basemaps anyway.

Thanks for participating, and check back here for results in a few weeks!
Read more ...